
》Check SMM silicon product quotes
》Order and view historical price trends of SMM metal spot cargo
SMM News on June 26, 2025:
In May 2025, China's PV glass exports reached 331,200 mt, a 7.17% decrease YoY and a 3.53% increase MoM. From January to May 2025, exports totaled 1.6545 million mt, a 6.12% increase YoY. Among these, India had the largest trade volume in May, with 125,300 mt, a significant 43.69% increase MoM. Due to the gradual implementation of new module capacity planning in India, subsequent module production is expected to rise, while local glass supply remains relatively limited. Therefore, procurement volume of glass began to increase from mid-to-late April, leading to a growth in demand in India in May.
Figure 1: China's PV glass exports in May 2025
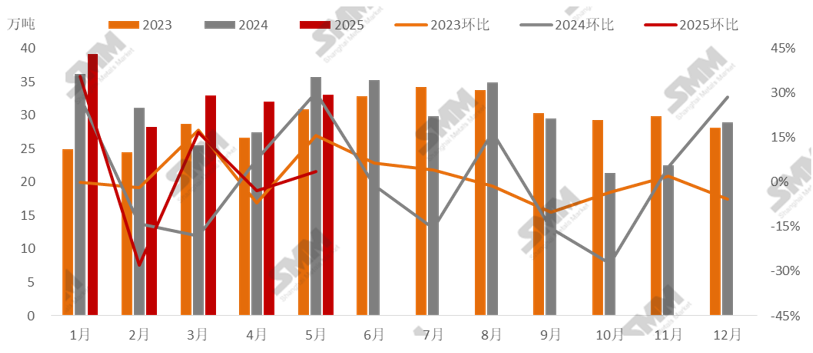
Source: General Administration of Customs, SMM
The top five export trading partners in May were India, Vietnam, Indonesia, the US, and Thailand, with no changes in the top five countries but some slight adjustments in rankings. The demand in the US led to a significant decrease in China's corresponding exports due to the impact of the previous trade war. In May, trade volume with the US was 26,600 mt, a 32.49% decrease MoM. However, it is expected that trade volume with the US will recover slightly after the window period following trade war negotiations. The top five trading partners accounted for 69.26% of total exports, with export concentration declining again. Overseas PV demand began to "blossom everywhere," and it is expected that while major overseas demand countries will still be concentrated in Southeast Asia, etc., glass demand in Europe, the Middle East, and other regions will increase rapidly in the future. For example, the UAE's trade volume in May was 3,100 mt, compared to only 700 mt in April, a significant 342.85% increase MoM. Trade volume in Saudi Arabia also increased slightly.
Figure 2: Statistics of China's PV glass exports in May 2025 (by trading partner)
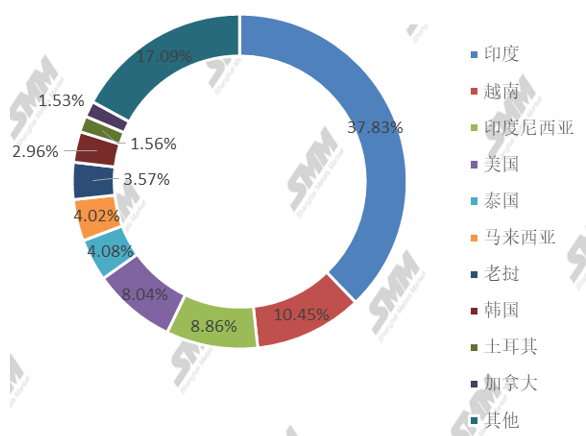
Source: General Administration of Customs, SMM
Compared to April's data, China's export volume to India was 125,300 mt, a significant 43.69% increase MoM, accounting for 37.83% of total exports, with export share increasing by nearly 10 percentage points. China's export volume to Vietnam was 34,600 mt, a 6.23% decrease MoM, accounting for 10.45% of total exports. The main export volume was directed to Chinese module companies to avoid export-related tariffs, with trade volume remaining basically stable. China's export volume to Indonesia was 29,400 mt, an 11.71% decrease MoM compared to April, rising to third place in trade volume. China's export volume to the US was 26,600 mt, a 32.49% decrease MoM, accounting for 8.04% of total exports. The impact of the trade war led to a drop in ranking to fourth place, but it is expected that export volume in June will increase slightly due to the easing of trade war restrictions. China's export volume to Thailand was 13,500 mt, a significant 51.09% decrease MoM, accounting for 4.08% of total exports. This was mainly due to US punitive tariffs, leading to a significant decrease in glass demand from Chinese module companies and a drop in trade volume to fifth place.

![[SMM PV News] Armenia Hits 1.1 GW Solar Capacity,](https://imgqn.smm.cn/usercenter/qQwIB20251217171741.jpg)
![Spot Market and Domestic Inventory Brief Review (February 5, 2026) [SMM Silver Market Weekly Review]](https://imgqn.smm.cn/usercenter/tSwaX20251217171735.jpg)